Find, fix, and prevent carbon emissions with a map of your entire production process
See the whole picture
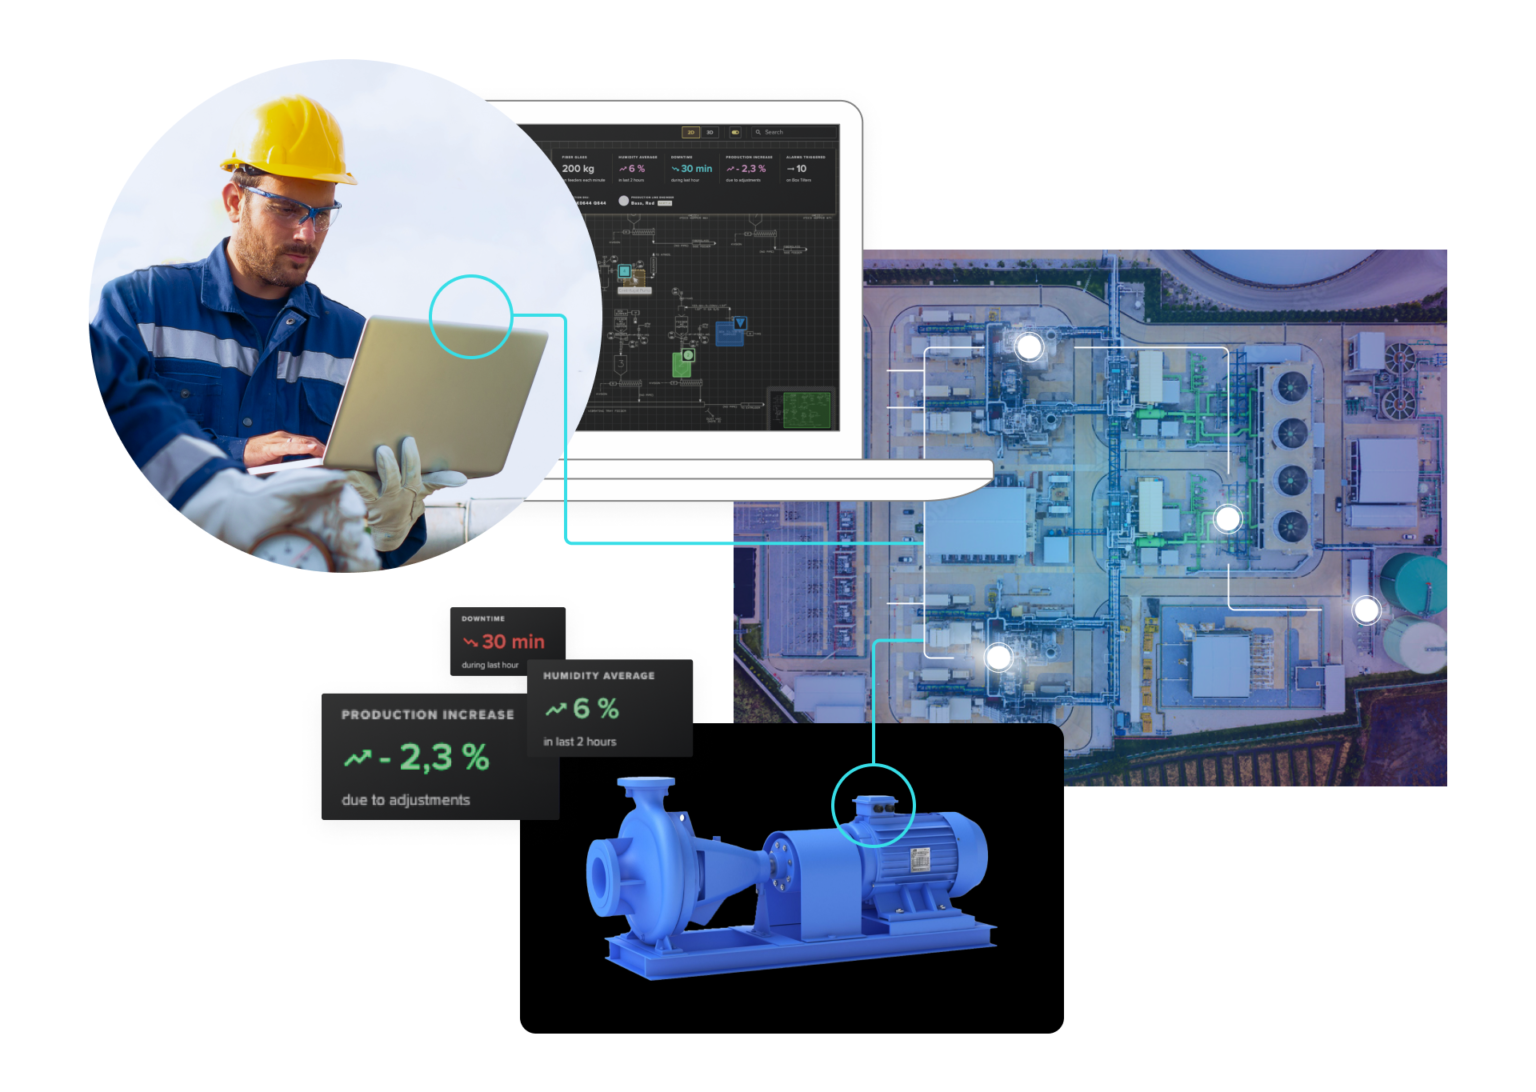
Visualize the entire production process to the asset level
Patent-pending view of contextual information for physical and virtual components across the production process. Find your problems, then fix them.
Key benefits:
- Ability to predict failures
- Connects vital data and information that help understand how production facilities and processes are working.
- Provides teams with complete visibility in a unified view of their entire operations in real time.
- Seamlessly identifies bottlenecks and equipment failures, prevents errors, and provides vital information to take action and improve operations by simulating production scenarios.

See what's possible for your production
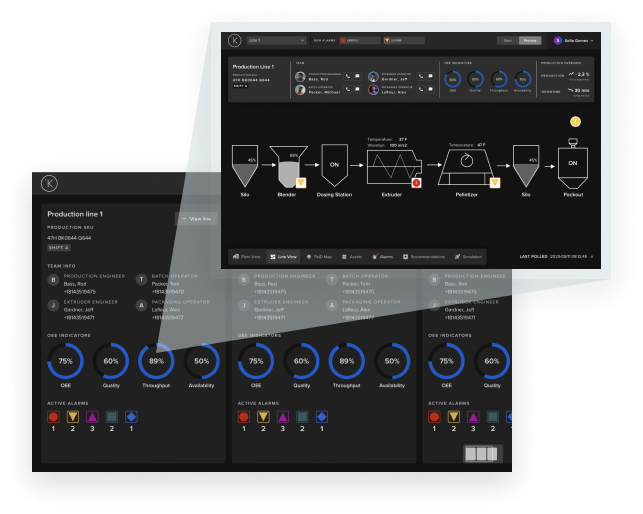
Simulate production scenarios
Quantify and cut real time carbon output by plugging into an intuitive and interactive digital twin that actively simulates your production lines.
Key benefits:
-
Condition-based monitoring to improve production outcomes and reduce maintenance costs
-
Get root-cause analysis to remove bottlenecks and communicate to resolve in real-time
-
Receive actionable insights to make control changes and automate operations
Achieve more together
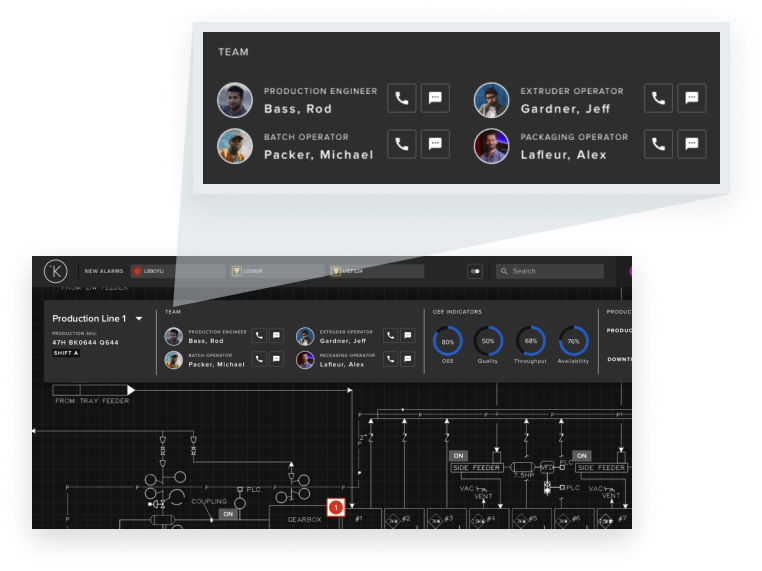
Collaborate with operators and production engineers
Align your teams in one collaborative environment to optimize production and lower emissions.
Key benefits:
-
Resolve issues through easy collaboration tools and connected workflows between stakeholders
-
Grant role-based access to information to retain appropriate context
-
Tap into enterprise IT like MS Teams and Slack to share updates across the organization


